Why this report was developed
Specialty crops in the U.S. This publication provides information on nearly 200 food and non-food crops in Texas. While statistical data are readily available on the “mega-crops” (such as cotton and wheat), acreage, production, market, and pest data are limited for the small acreage specialty crops. However, since these minor crops generate 28% of all crop receipts in Texas, statistical details are essential to sustain economic production.
Timely pesticide clearances are paramount to sustain safe, economical domestic food production. Kiplinger reports (Feb. 20, 2004) that by 2010, U. S. agricultural imports will grossly exceed ag exports – as consumer incomes increase and year-round demand soars for high value fresh foods and flowers. About 80% of these imports will go head-to-head with U.S. commodities.
Pests and pesticides. Weeds, insects, and diseases indiscriminately attack these specialty crops causing yield losses, imposing costs, and impacting the quality of fresh and processed foods. Pesticides are essential, but availability is limited since small crops don’t attract the capital required to obtain federal registrations.
The IR-4 program. The Inter-Regional 4 project (IR-4) is a focal point to coordinate USDA and land grant university work with U.S. EPA, private firms/registrants, and commodity interests. All share a common purpose in obtaining pesticide labels in timely economical ways, with emphasis on minor crops. Historically, more than 62% of all pesticide tolerances granted by the U.S. EPA have been based on IR-4 petitions.Crop groupings and contents. The Crop Grouping System was mutually developed by U.S. EPA and USDA partners. This system places more than 500 crops into one of 20 groups, based on similar biological traits and edible parts, for regulatory efficiency. For example, all root and tuber crops are in
Crop Group 1. Then pesticide data from “representative crops”, such as carrots, can be extended to 30 similar crops, such as parsnips and turnips.
This report summarizes acreage, economic values, and descriptions for 200 crops of economic importance to Texas. Non-food crops, industrial crops (such as kenaf), seed and sprig production, greenhouse crops (such as transplants and tomatoes), and ornamental/landscape plants, were included for a more inclusive summary.
Appendices include information on pesticide facts, honey bee pollination, fertilization practices, harvest methods, worker exposures, and market use.
How this report was developed
Background. After repeated requests on the 1997 “Small Acreage Crops of Texas”, we decided to revise and expand this publication. We worked with 50 experts over two years to obtain the best information available. Details were gleaned from crop breeders, agronomists, horticulturists, TCE specialists, commodity leaders, crop consultants, the Texas Prison System, and others. Most data were derived from several sources and were reconciled. We hope everyone was adequately acknowledged.
USDA National Agricultural Statistics Service (NASS) survey data covers the top 10 agronomic crops and 20 horticultural crops. The USDA Farm Service Agency (FSA) provided information on additional crops.
Cash values. “Values per acre” (gross cash receipts per acre) are an average of the cash revenues per acre, considering variations in yields, quality, and markets (fresh, processing, etc). Many of these values were obtained from TCE Crop Enterprise Budgets on average yields and prices or by extrapolating from similar crops.
Data verifications. This report is probably the most holistic compilation of plant-based agriculture in Texas. While actual details may vary between years, most acreage data are within 4 to 10% of a 4-year average planted acres between 2000 and 2003 and cash values are within 8 to 15% of gross returns, considering year-to-year swings in weather and markets. We elected to use “planted acres” rather than year-end “harvested acres”. If you know of better numbers or see major errors of fact, we would like to hear from you.
Crop descriptions. A brief description is provided for each crop. Most descriptions highlight production traits, market niches, and pest problems, summarizing key features and pesticide needs. Since this daunting task covered nearly 200 crops and we didn’t want to take ourselves too seriously, the text was lightened up with a few humorous comments along the way.
Using this report
Crop group organization. Information is organized by Crop Groups so similar crops are presented together. Table 1 shows the crop group numbers, names and crop examples. For example, Crop Group 5 on Brassica and Cole Crops includes broccoli, cabbage, collards, and others. You’ll get the idea quickly.
For easy overall reference, crops are also listed in alphabetical order in the last Appendix. Each Crop Group section contains a table listing the crops grown in Texas, total acres in the state, cash value per acre, and total value for the state (aggregate receipts or economic value in the state’s agricultural economy). Regional acres were derived from several sources and regional crop experts. Details were too numerous for specific attributes but key individuals are listed in the appendix.
Economic multipliers. Economic multipliers were not included but range from 2.8 to 3.5 depending on processing and “value added” and may be applied to Total Values as a measure of economic impact in the total state economy.
| Crop Group No. | Group Name | Examples |
|---|---|---|
| 1 and 2 | Root & tuber | Carrots & potatoes |
| 3 | Bulb crops | Onions & garlic |
| 4 | Leafy greens & petioles | Lettuce, spinach & celery |
| 5 | Brassica/cole crops | Broccoli, cabbage & kale |
| 6 and 7 | Beans & vegetable legumes | Beans & peas |
| 8 | Fruiting vegetables | Peppers & tomatoes |
| 9 | Curcurbits/melons | Melons & vine crops |
| 10 | Citrus & subtropical fruits | Grapefruit, avocados & lemons |
| 11 and 12 | Tree crops | Apples & peaches |
| 13 and 14 | Berry & nut crops | Blackberries & pecans |
| 15 and 16 | Grains, fibers, & oilseed crops | Corn, wheat, cotton, peanuts & soybeans |
| 17 | Forage grasses | Bermuda & grazed small grains |
| 18 | Forage legumes | Alfalfa & clovers |
| 19 | Herbs & spices | Basil, dill & mint |
| 20 | Miscellaneous crops | Aloe to sugarcane |
| None | Non-food | Flowers, sod, hemp & kenaf |
| None | Planting seed & sod | Alfalfa to zoysiagrass |
| None | Ornamental, nursery & greenhouse | Transplants & container stock |
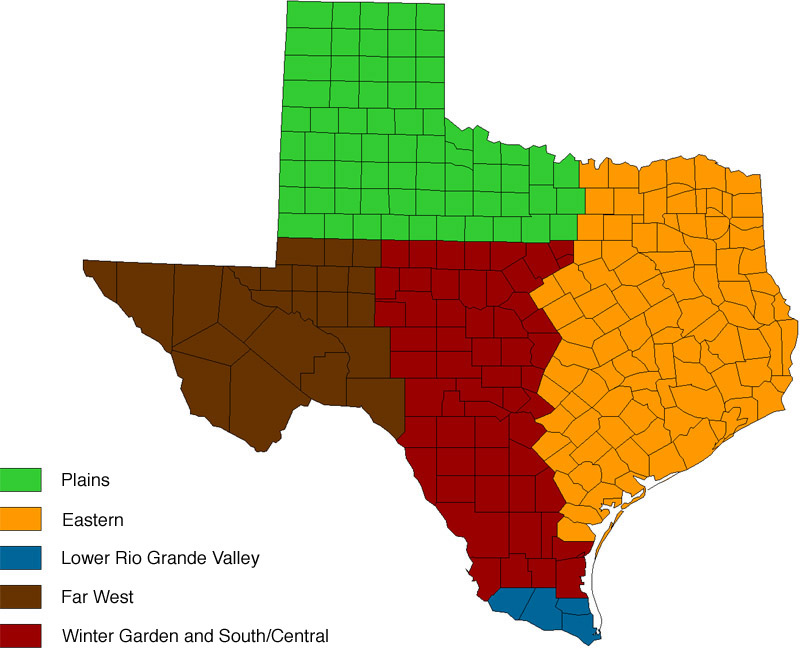
Production regions of Texas
Five regions were defined to organize geographical information and are used in presenting acreage data in the tables that follow. These include Plains, Eastern, Lower Rio Grande Valley, Far West Texas, and Central and South areas, as shown on the map. More details are listed in Appendix 1.