Its the middle of January and at this point, growers are starting to wonder how the year is shaping up for winter chilling. Commercial growers can apply growth regulators to overcome insufficient chilling, but they need to know and make the application in early February if it is needed. For most, they may wonder, or worry, but we still want to know how we stand in comparison to other years. I posted some comments last month about the kind of equipment we use to record weather data, but wanted to share a little more about what that equipment gives us. I normally download weather data every couple of weeks, tally hours below 45°F, and keep a running total. Our Hobo Dataloggers give us this kind of a graph:
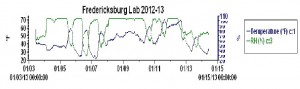
We can then export those data into an excel file and count chilling segments (we have the dataloggers set to record temps every 15 minutes). As of today, January 14, 2013, the we have recorded 487 hours of winter chilling below 45°F, which is about on par with what we have been seeing the past few years. The chart below can give you some perspective on how we stand compared with the past six winter seasons.
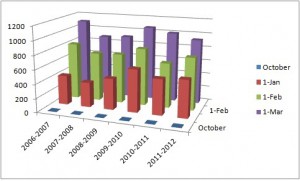
It appears we are on track, at least so far, for a normal, to above normal chilling year. I commonly get questions about climate change and variety selection. Often people wonder that if our temperatures are getting warmer, shouldn’t we be planting trees with chilling requirements somewhat lower than the old average chilling zones we have been using. Our answer is that at least so far, this change has not really affected our chilling totals. The amount of chilling we receive from season to season does fluctuate, but in Fredericksburg, where the average is about 800 hours per winter, over the past six seasons, we have been over the norm. This will cycle and we will get some warm winters in the future, but from what we can tell, no need to change the chilling range of the varieties we are planting.